Although the goal of the Argo Online school is to teach the basics of the Argo data, and therefore, we explain the data using the primary source, it is worth mentioning argopy:
is a python library dedicated to Argo data access, manipulation and visualisation for standard users as well as Argo experts. the Argo dataset is very complex: with thousands of different variables, tens of reference tables and a user manual more than 100 pages long: argopy aims to help you navigate this complex realm.
In this notebook we show a few examples, but we refer to the argopy Gallery for a more detailled explanation:
R : real time; D : delayed mode; A : real time with adjustment
casted :
1
[166 values with dtype=<U1]
PLATFORM_TYPE
(N_PROF)
<U32
...
long_name :
Type of float
conventions :
Argo reference table 23
casted :
1
[166 values with dtype=<U32]
FLOAT_SERIAL_NO
(N_PROF)
<U32
...
long_name :
Serial number of the float
casted :
1
[166 values with dtype=<U32]
FIRMWARE_VERSION
(N_PROF)
<U32
...
long_name :
Instrument firmware version
casted :
1
[166 values with dtype=<U32]
WMO_INST_TYPE
(N_PROF)
int64
...
long_name :
Coded instrument type
conventions :
Argo reference table 8
casted :
1
[166 values with dtype=int64]
JULD
(N_PROF)
datetime64[ns]
...
long_name :
Julian day (UTC) of the station relative to REFERENCE_DATE_TIME
standard_name :
time
conventions :
Relative julian days with decimal part (as parts of day)
resolution :
0.0
axis :
T
casted :
1
[166 values with dtype=datetime64[ns]]
JULD_QC
(N_PROF)
int64
...
long_name :
Quality on date and time
conventions :
Argo reference table 2
casted :
1
[166 values with dtype=int64]
JULD_LOCATION
(N_PROF)
datetime64[ns]
...
long_name :
Julian day (UTC) of the location relative to REFERENCE_DATE_TIME
conventions :
Relative julian days with decimal part (as parts of day)
resolution :
0.0
casted :
1
[166 values with dtype=datetime64[ns]]
LATITUDE
(N_PROF)
float64
...
long_name :
Latitude of the station, best estimate
standard_name :
latitude
units :
degree_north
valid_min :
-90.0
valid_max :
90.0
axis :
Y
casted :
1
[166 values with dtype=float64]
LONGITUDE
(N_PROF)
float64
...
long_name :
Longitude of the station, best estimate
standard_name :
longitude
units :
degree_east
valid_min :
-180.0
valid_max :
180.0
axis :
X
casted :
1
[166 values with dtype=float64]
POSITION_QC
(N_PROF)
int64
...
long_name :
Quality on position (latitude and longitude)
conventions :
Argo reference table 2
casted :
1
[166 values with dtype=int64]
POSITIONING_SYSTEM
(N_PROF)
<U8
...
long_name :
Positioning system
casted :
1
[166 values with dtype=<U8]
PROFILE_PRES_QC
(N_PROF)
<U3
...
long_name :
Global quality flag of PRES profile
conventions :
Argo reference table 2a
casted :
1
[166 values with dtype=<U3]
PROFILE_TEMP_QC
(N_PROF)
<U3
...
long_name :
Global quality flag of TEMP profile
conventions :
Argo reference table 2a
casted :
1
[166 values with dtype=<U3]
PROFILE_PSAL_QC
(N_PROF)
<U3
...
long_name :
Global quality flag of PSAL profile
conventions :
Argo reference table 2a
casted :
1
[166 values with dtype=<U3]
VERTICAL_SAMPLING_SCHEME
(N_PROF)
<U256
...
long_name :
Vertical sampling scheme
conventions :
Argo reference table 16
casted :
1
[166 values with dtype=<U256]
CONFIG_MISSION_NUMBER
(N_PROF)
int64
...
long_name :
Unique number denoting the missions performed by the float
conventions :
1...N, 1 : first complete mission
casted :
1
[166 values with dtype=int64]
PRES
(N_PROF, N_LEVELS)
float32
...
long_name :
Sea water pressure, equals 0 at sea-level
standard_name :
sea_water_pressure
units :
decibar
valid_min :
0.0
valid_max :
12000.0
C_format :
%7.1f
FORTRAN_format :
F7.1
resolution :
1.0
axis :
Z
casted :
1
[16268 values with dtype=float32]
PRES_QC
(N_PROF, N_LEVELS)
int64
...
long_name :
quality flag
conventions :
Argo reference table 2
casted :
1
[16268 values with dtype=int64]
PRES_ADJUSTED
(N_PROF, N_LEVELS)
float32
...
long_name :
Sea water pressure, equals 0 at sea-level
standard_name :
sea_water_pressure
units :
decibar
valid_min :
0.0
valid_max :
12000.0
C_format :
%7.1f
FORTRAN_format :
F7.1
resolution :
1.0
axis :
Z
casted :
1
[16268 values with dtype=float32]
PRES_ADJUSTED_QC
(N_PROF, N_LEVELS)
int64
...
long_name :
quality flag
conventions :
Argo reference table 2
casted :
1
[16268 values with dtype=int64]
PRES_ADJUSTED_ERROR
(N_PROF, N_LEVELS)
float32
...
long_name :
Contains the error on the adjusted values as determined by the delayed mode QC process
units :
decibar
C_format :
%7.1f
FORTRAN_format :
F7.1
resolution :
1.0
casted :
1
[16268 values with dtype=float32]
TEMP
(N_PROF, N_LEVELS)
float32
...
long_name :
Sea temperature in-situ ITS-90 scale
standard_name :
sea_water_temperature
units :
degree_Celsius
valid_min :
-2.5
valid_max :
40.0
C_format :
%9.3f
FORTRAN_format :
F9.3
resolution :
0.001
casted :
1
[16268 values with dtype=float32]
TEMP_QC
(N_PROF, N_LEVELS)
int64
...
long_name :
quality flag
conventions :
Argo reference table 2
casted :
1
[16268 values with dtype=int64]
TEMP_ADJUSTED
(N_PROF, N_LEVELS)
float32
...
long_name :
Sea temperature in-situ ITS-90 scale
standard_name :
sea_water_temperature
units :
degree_Celsius
valid_min :
-2.5
valid_max :
40.0
C_format :
%9.3f
FORTRAN_format :
F9.3
resolution :
0.001
casted :
1
[16268 values with dtype=float32]
TEMP_ADJUSTED_QC
(N_PROF, N_LEVELS)
int64
...
long_name :
quality flag
conventions :
Argo reference table 2
casted :
1
[16268 values with dtype=int64]
TEMP_ADJUSTED_ERROR
(N_PROF, N_LEVELS)
float32
...
long_name :
Contains the error on the adjusted values as determined by the delayed mode QC process
units :
degree_Celsius
C_format :
%9.3f
FORTRAN_format :
F9.3
resolution :
0.001
casted :
1
[16268 values with dtype=float32]
PSAL
(N_PROF, N_LEVELS)
float32
...
long_name :
Practical salinity
standard_name :
sea_water_salinity
units :
psu
valid_min :
2.0
valid_max :
41.0
C_format :
%9.3f
FORTRAN_format :
F9.3
resolution :
0.001
casted :
1
[16268 values with dtype=float32]
PSAL_QC
(N_PROF, N_LEVELS)
int64
...
long_name :
quality flag
conventions :
Argo reference table 2
casted :
1
[16268 values with dtype=int64]
PSAL_ADJUSTED
(N_PROF, N_LEVELS)
float32
...
long_name :
Practical salinity
standard_name :
sea_water_salinity
units :
psu
valid_min :
2.0
valid_max :
41.0
C_format :
%9.3f
FORTRAN_format :
F9.3
resolution :
0.001
casted :
1
[16268 values with dtype=float32]
PSAL_ADJUSTED_QC
(N_PROF, N_LEVELS)
int64
...
long_name :
quality flag
conventions :
Argo reference table 2
casted :
1
[16268 values with dtype=int64]
PSAL_ADJUSTED_ERROR
(N_PROF, N_LEVELS)
float32
...
long_name :
Contains the error on the adjusted values as determined by the delayed mode QC process
units :
psu
C_format :
%9.3f
FORTRAN_format :
F9.3
resolution :
0.001
casted :
1
[16268 values with dtype=float32]
PARAMETER
(N_PROF, N_CALIB, N_PARAM)
<U16
...
long_name :
List of parameters with calibration information
conventions :
Argo reference table 3
casted :
1
[498 values with dtype=<U16]
SCIENTIFIC_CALIB_EQUATION
(N_PROF, N_CALIB, N_PARAM)
<U256
...
long_name :
Calibration equation for this parameter
casted :
1
[498 values with dtype=<U256]
SCIENTIFIC_CALIB_COEFFICIENT
(N_PROF, N_CALIB, N_PARAM)
<U256
...
long_name :
Calibration coefficients for this equation
casted :
1
[498 values with dtype=<U256]
SCIENTIFIC_CALIB_COMMENT
(N_PROF, N_CALIB, N_PARAM)
<U256
...
long_name :
Comment applying to this parameter calibration
casted :
1
[498 values with dtype=<U256]
SCIENTIFIC_CALIB_DATE
(N_PROF, N_CALIB, N_PARAM)
datetime64[ns]
...
long_name :
Date of calibration
conventions :
YYYYMMDDHHMISS
casted :
1
[498 values with dtype=datetime64[ns]]
HISTORY_INSTITUTION
(N_HISTORY, N_PROF)
<U1
...
long_name :
Institution which performed action
conventions :
Argo reference table 4
casted :
1
[0 values with dtype=<U1]
HISTORY_STEP
(N_HISTORY, N_PROF)
<U1
...
long_name :
Step in data processing
conventions :
Argo reference table 12
casted :
1
[0 values with dtype=<U1]
HISTORY_SOFTWARE
(N_HISTORY, N_PROF)
<U1
...
long_name :
Name of software which performed action
conventions :
Institution dependent
casted :
1
[0 values with dtype=<U1]
HISTORY_SOFTWARE_RELEASE
(N_HISTORY, N_PROF)
<U1
...
long_name :
Version/release of software which performed action
conventions :
Institution dependent
casted :
1
[0 values with dtype=<U1]
HISTORY_REFERENCE
(N_HISTORY, N_PROF)
<U1
...
long_name :
Reference of database
conventions :
Institution dependent
casted :
1
[0 values with dtype=<U1]
HISTORY_DATE
(N_HISTORY, N_PROF)
datetime64[ns]
...
long_name :
Date the history record was created
conventions :
YYYYMMDDHHMISS
casted :
1
[0 values with dtype=datetime64[ns]]
HISTORY_ACTION
(N_HISTORY, N_PROF)
<U1
...
long_name :
Action performed on data
conventions :
Argo reference table 7
casted :
1
[0 values with dtype=<U1]
HISTORY_PARAMETER
(N_HISTORY, N_PROF)
<U1
...
long_name :
Station parameter action is performed on
conventions :
Argo reference table 3
casted :
1
[0 values with dtype=<U1]
HISTORY_START_PRES
(N_HISTORY, N_PROF)
float32
...
long_name :
Start pressure action applied on
units :
decibar
casted :
1
[0 values with dtype=float32]
HISTORY_STOP_PRES
(N_HISTORY, N_PROF)
float32
...
long_name :
Stop pressure action applied on
units :
decibar
casted :
1
[0 values with dtype=float32]
HISTORY_PREVIOUS_VALUE
(N_HISTORY, N_PROF)
float32
...
long_name :
Parameter/Flag previous value before action
casted :
1
[0 values with dtype=float32]
HISTORY_QCTEST
(N_HISTORY, N_PROF)
<U1
...
long_name :
Documentation of tests performed, tests failed (in hex form)
conventions :
Write tests performed when ACTION=QCP$; tests failed when ACTION=QCF$
casted :
1
[0 values with dtype=<U1]
title :
Argo float vertical profile
institution :
FR GDAC
source :
Argo float
history :
2023-04-24T09:47:18Z creation
references :
http://www.argodatamgt.org/Documentation
user_manual_version :
3.1
Conventions :
Argo-3.1 CF-1.6
featureType :
trajectoryProfile
apDS.TEMP
<xarray.DataArray 'TEMP' (N_PROF: 166, N_LEVELS: 98)> Size: 65kB
[16268 values with dtype=float32]
Dimensions without coordinates: N_PROF, N_LEVELS
Attributes: (9)
xarray.DataArray
'TEMP'
N_PROF: 166
N_LEVELS: 98
...
[16268 values with dtype=float32]
long_name :
Sea temperature in-situ ITS-90 scale
standard_name :
sea_water_temperature
units :
degree_Celsius
valid_min :
-2.5
valid_max :
40.0
C_format :
%9.3f
FORTRAN_format :
F9.3
resolution :
0.001
casted :
1
The core-Argo profile files contain the core parameters provided by a float: pressure, temperature, salinity, conductivity (PRES, TEMP, PSAL, CNDC).
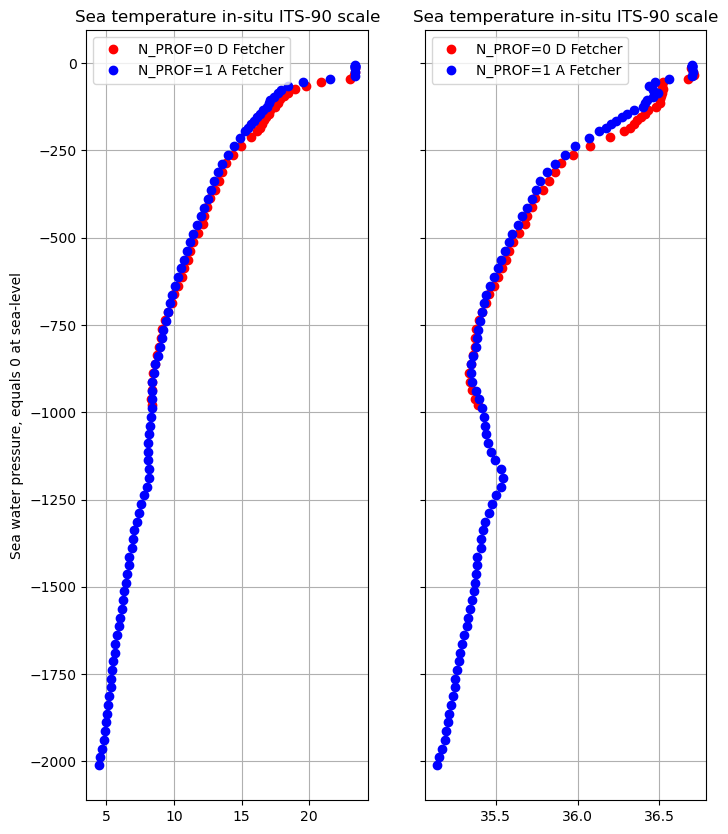
Now, let’s see how this argopy data set works as a xarray, and it easy to plot any data. Let’s begin ploting the first two profiles:
fig,ax=plt.subplots(1,2,figsize=(8,10),sharey=True)#Temperatureax[0].plot(apDS.TEMP[0,:],-apDS.PRES[0,:],'ro',label='N_PROF=0 D Fetcher')ax[0].plot(apDS.TEMP[1,:],-apDS.PRES[1,:],'bo',label='N_PROF=1 A Fetcher')ax[0].set_title(apDS['TEMP'].attrs['long_name'])ax[0].set_ylabel(apDS['PRES'].attrs['long_name'])ax[0].grid()ax[0].legend();ax[1].plot(apDS.PSAL[0,:],-apDS.PRES[0],'ro',label='N_PROF=0 D Fetcher')ax[1].plot(apDS.PSAL[1,:],-apDS.PRES[1],'bo',label='N_PROF=1 A Fetcher')ax[1].set_title(apDS['TEMP'].attrs['long_name'])ax[1].grid()ax[1].legend();
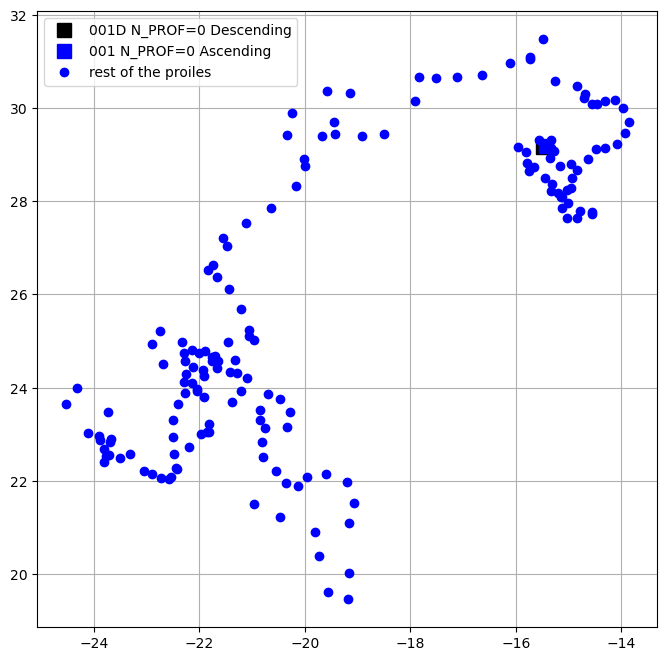
and of course the locations of these two profiles and the rest of them:
fig,ax=plt.subplots(figsize=(8,8))ax.plot(apDS.LONGITUDE[0],apDS.LATITUDE[0],'ks',markersize=10,label='001D N_PROF=0 Descending')ax.plot(apDS.LONGITUDE[1],apDS.LATITUDE[1],'bs',markersize=10,label='001 N_PROF=0 Ascending')ax.plot(apDS.LONGITUDE[2:],apDS.LATITUDE[2:],'bo',label='rest of the proiles')ax.grid()ax.legend();
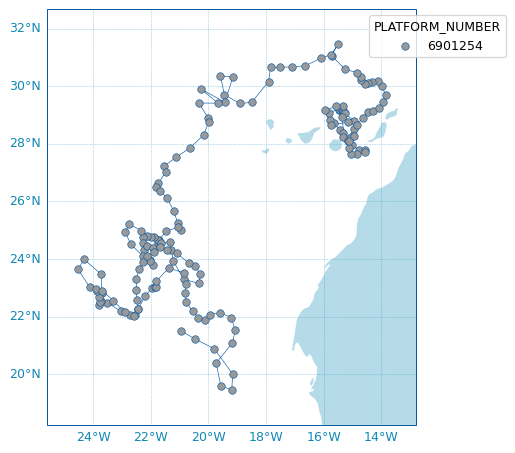
or using the plotting routines of argopy, easyly we can plot the full trayectory
scatter_map(apDS,set_global=False);
/Users/pvb/miniconda3/envs/AOS/lib/python3.13/site-packages/argopy/plot/plot.py:489: UserWarning: More than one N_LEVELS found in this dataset, scatter_map will use the first level only
  warnings.warn(
argopy is powerfull with continous updates, an de refer to the argopy Documentation for a more detailled explanation of its capabilities.