
Real-Time and Delayed mode data#
%%HTML
<center>
<iframe width="560" height="315" src="https://drive.google.com/file/d/1PDwmj7AsbDoy9tLNMdtTc7q_Mey2LvxH/preview" width="640" height="480" title="The Argo Data" frameborder="0" allow="accelerometer; autoplay; clipboard-write; encrypted-media; gyroscope; picture-in-picture" allowfullscreen></iframe>
</center>
There are numerous reasons why data can be reported abnormally during the Argo profiler’s operating cycles. This might be mainly due to problems related to the CTD sensors, either external interference to the sensor, for instance, due to biodeposition, or intrinsic problems of the sensor itself: In both cases, incorrect data with spikes, biases, sensor drifts, etc., can be reported as bad data or possible bad data.
However, detecting problems related to the CTD sensors, sometimes, can sometimes be very difficult. Even more so when we take into account the concept of “natural variability”. Natural variability is just the natural change of the properties of the ocean and it may happen in periods ranging from seconds to millennia. For instance, changes occur daily, such as the tides; sporadically, such as storm surges or tsunamis; and seasonally, such as the simple warming of coastal waters in summer. In addition to the uncertainty associated with sensor errors, natural systems have an uncertainty associated with the range of natural variability itself. In such cases, it is very difficult to distinguish between the natural variability observed and the errors.
Since there is also natural variability in the temperature and salinity that can be mistaken for sensor malfunction, we have to be careful not to treat actual natural variability as sensor malfunction and correct it. For instance, a float may drift into saltier waters and we may misinterpret the change as sensor malfunctioning if we do not check out the trajectory of the float. It may also happen that an area of the ocean is becoming saltier than it used to be, and therefore if we compare the data with historical data, we risk losing this natural variability. Therefore, it is also necessary to compare the float’s data with data from neighboring floats.
That is why a robust data analysis system has been developed to assist us in distinguishing between the natural variability of the area where the profiler is located and a possible sensor malfunction, and if in doubt, it is better not to correct the data.
%%HTML
<center>
<iframe width="560" height="315" src="https://drive.google.com/file/d/18NM9vPb1gJ94keeXA50h6-T6zGvfoV6_/preview" width="640" height="480" title="The Argo Data" frameborder="0" allow="accelerometer; autoplay; clipboard-write; encrypted-media; gyroscope; picture-in-picture" allowfullscreen></iframe>
</center>
All the data will be distributed in the GTS, but with its corresponding quality flags, that give an indication of the quality of the data. On the other hand, the data and its flags will be also converted to the netCDF format and sent to the Argo Global Data Management Centers (GDAC).
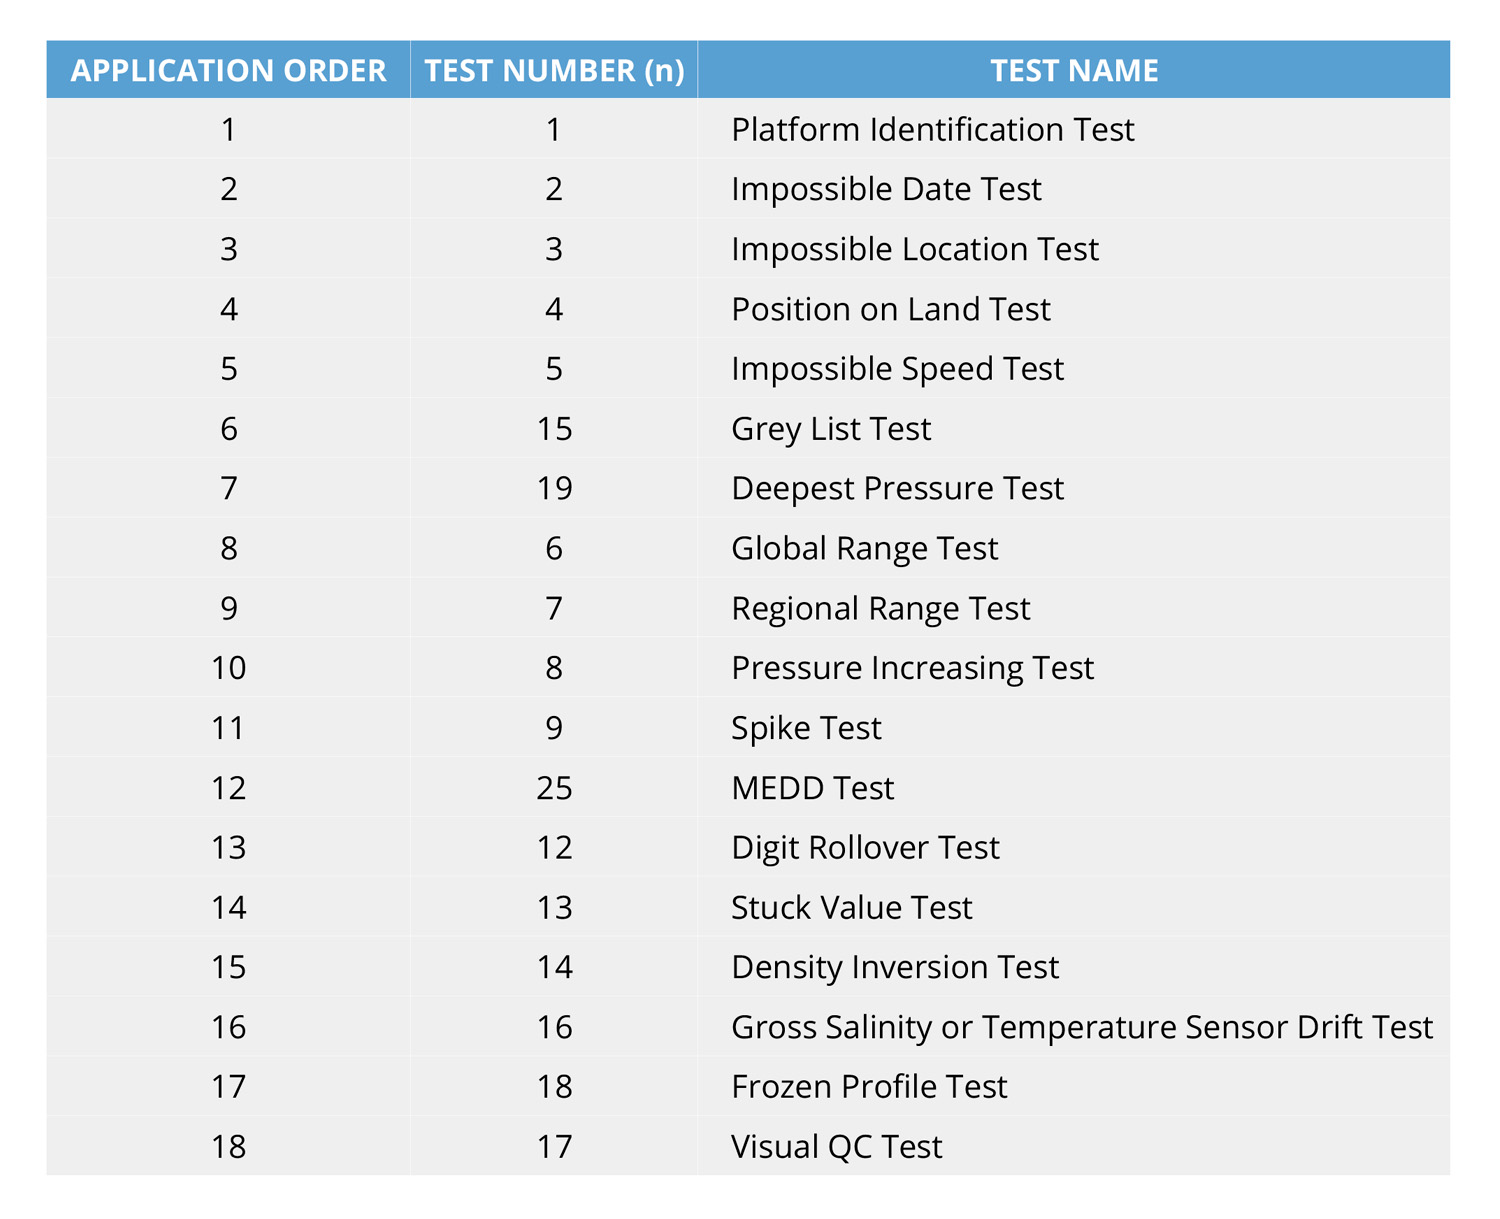
For instance, test 1 verifies whether the maximum pressure measured by a float is higher than the ocean depth in the location of the float; test 5 verifies if the location reported by the float is actually in the ocean, or if by error it is reporting a position overland; test 17 checks whether the float is sending, again and again, the same data, etc. We don’t expect you to learn what every test is about, but if you are curious about all of them, take a look at the Argo Quality Control Manual.
%%HTML
<center>
<iframe width="560" height="315" src="https://drive.google.com/file/d/1SJXoCYij8muWN-zQVlD5pViSJKUJVjWJ/preview" width="640" height="480" title="The Argo Data" frameborder="0" allow="accelerometer; autoplay; clipboard-write; encrypted-media; gyroscope; picture-in-picture" allowfullscreen></iframe>
</center>
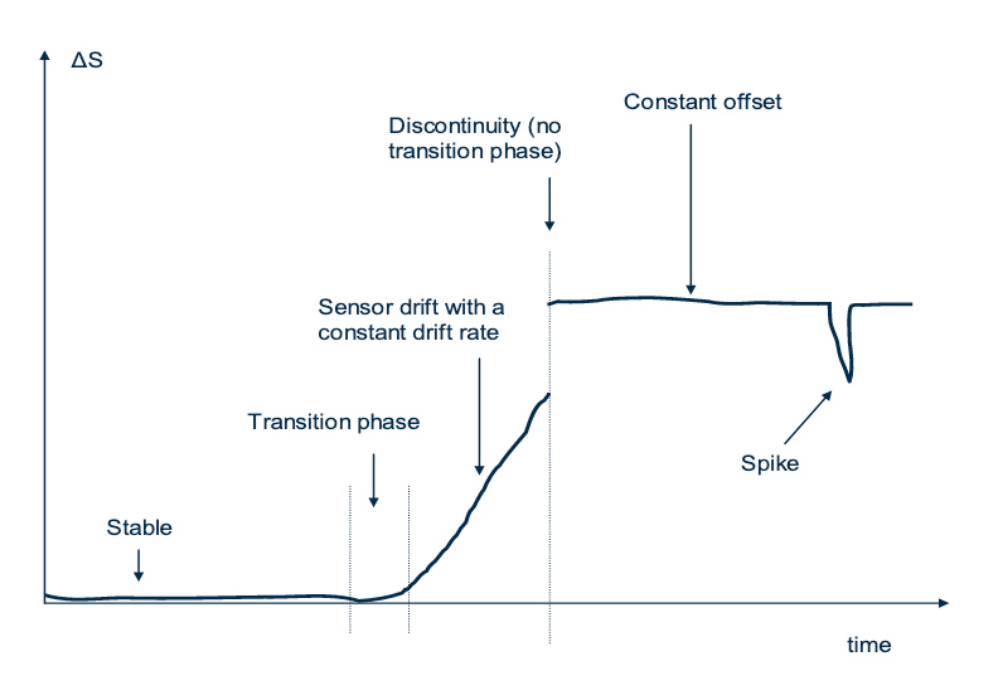
The spikes are abrupt short changes in the data and constitute a clear case of anomaly. Spikes are easy to detect and correct. Drifts and offsets can be identified in the trend of ΔS over time, where ΔS is the difference in salinity between float-measured values and statistical recommendations. If ΔS = a + bt, where t is time, then a is the offset and b is the drift rate. Note that these drifts and offsets can be sensor-related, or they can be due to natural variability, as we explained before. To distinguish between sensor errors and natural variability evaluation it is necessary that experts look carefully at the data.
%%HTML
<center>
<iframe width="560" height="315" src="https://drive.google.com/file/d/1_EXR0_TfQJKl49QlhigpZTHUSHVOVROT/preview" width="640" height="480" title="The Argo Data" frameborder="0" allow="accelerometer; autoplay; clipboard-write; encrypted-media; gyroscope; picture-in-picture" allowfullscreen></iframe>
</center>
Biodeposition is one of the main reasons why DM quality control is so necessary. Small accumulations of organic matter, like the algae that grow in the pools in summer, known as biodeposition, may affect the measurement’s accuracy by microscopic alterations of the sensor’s shape. It mainly affects the conductivity sensors that allow us to measure salinity, and the effect of biodeposition is very small in most cases, but its effects on the data are approximate of the same order as the natural variations of the ocean. But, what does it exactly mean? At first glance, we would not be able to know if a potential error is due to the natural variability of the area or due to processes such as biodeposition. Thus, one of the main obstacles since the start of the Argo Program was providing a technique that allowed us to distinguish between natural variations in salinity and the drift of the conductivity sensor due to biodeposition. The Delayed - Mode quality control is based on a statistical estimation called objective analysis; it provides a solid basis for interpolating irregularly spaced data. During the first years of the Argo era, researchers from the University of Washington and the Woods Hole Oceanographic Institution developed a method based on the comparison of all measurements of each Argo float and historical data at certain depth levels characterized by stability in salinity, but dependent on each zone. This method is known as Delayed Mode (DM) calibration and is currently used for each of the floats. This type of calibration is repeated, at least, every year to guarantee the accuracy of the measurements. As we said before, this analysis is crucial to keeping measurements that don’t coincide with historical records but that contain natural variability unknown to date. Each data set must be carefully analyzed and, despite good tools such as objective analysis, the final decision on a possible data correction rests in the hands of the expert, what we call the DM operator. To keep a record of all the actions performed, the data verified through the DM quality control will be marked with a “D” and those that have only been verified by the RT quality control will be marked with an “R”:
• If the DM quality control has been performed after one year of data and the float is still active, both data collected in Real-Time “R” and data verified through DM quality control “D” will be available, being the latter the one with the highest quality.
• Once a float is declared as inactive, data will be collected in the GDAC as “D” and it will contain both adjusted and unadjusted data. [L2-G1] (creo que se refiere al L2-G4 que ponemos debajo en una gráfica que se entienda bien)
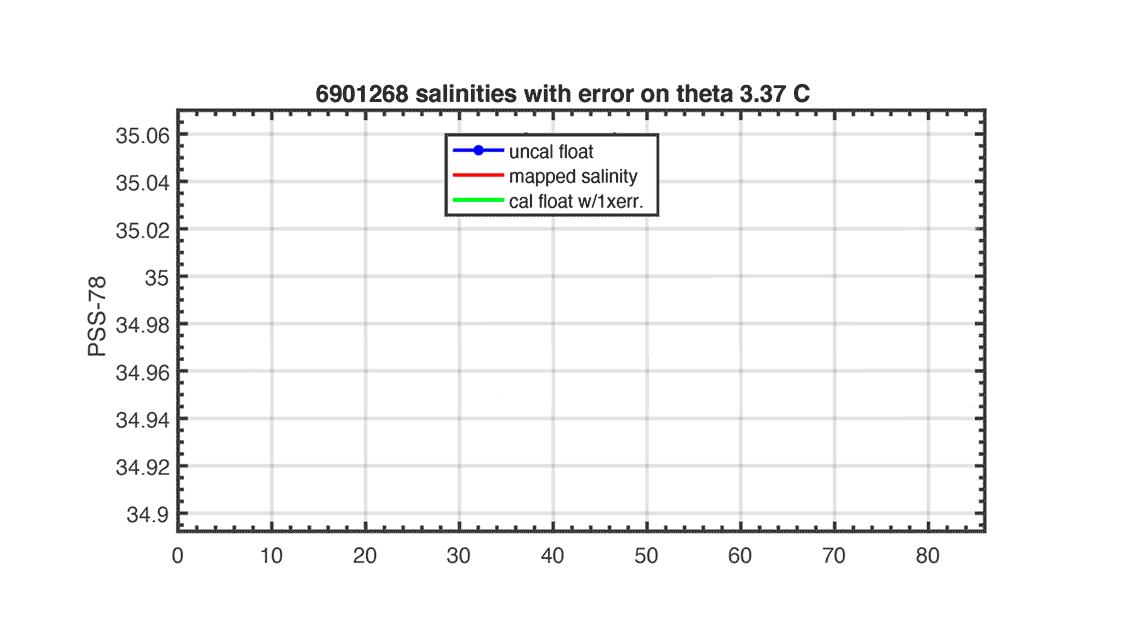
There is no need to keep digging deeper into technical details about the DM control but let’s take a look at this graphic to make sure you understand the basics. The original signal from the Argo profiler is shown in blue color, which describes clear anomalous behavior. The red lines are the historical data in the area near the Argo float. The calibration suggests a correction based on them (green color), however, the final decision, together with other complementary analyzes, is in the hands of the DM. Regardless of any changes done during the RT and DM quality controls, all the data is kept and included in the NetCDF files.